SOUND LIKE SOMETHING you’ve heard? Or read? Or believe to be true?
Investors don’t just tend to focus mostly on shorter term volatility (Chapter 3). They often fear volatility is increasing! And it may feel true. We had a big bear market in 2008—the biggest since the Great Depression. Soon after, there was a big global correction in 2010 on eurozone-implosion fears. And another big correction in 2011 and a smaller though still scary correction in 2012. Many posit the onset of high-frequency trading and speculators have contributed to increasing levels of stock volatility.
Don’t believe it—it’s a myth.
First, volatility is itself volatile. It’s normal to go through periods of higher and lower volatility. Second, it’s a fallacy to assume higher volatility spells trouble. Third—volatility in recent years (as I write) isn’t all that unusual and is well within normal historical ranges.
Pop quiz: Which year was more volatile? 2008 or 2009?
Most investors will automatically know US and global stocks fell huge in 2008 and then boomed huge in 2009. But they may wrongly assume stocks were more volatile in 2008.
Not so. As measured by standard deviation (a widely used metric for volatility), 2008’s standard deviation was 20.1% and 2009’s was 21.3%.1 (Measured using US stocks, which I use throughout this chapter for their longer history.) Yes! 2009 was more volatile!
How can it be? To understand that, you must understand a few things about standard deviation. Standard deviation is just what it sounds like—a measure of how much something deviates from its average. It can be used to measure historical volatility of single stocks, sectors, the market as a whole, anything for which you have enough data points—sunny days in San Francisco, rainy days in Portland. A low standard deviation means results didn’t vary much from the average. A higher standard deviation means there was more variability.
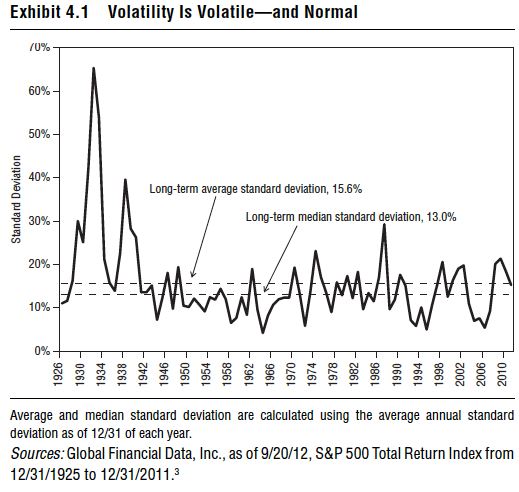
As of year-end 2011, the S&P 500’s annualized standard deviation since 1926 was 15.6%.2 (That’s based on monthly returns. You can measure standard deviation with yearly returns, but you get fewer data points. You can measure with daily returns as well, but I’m not sure why you’d want to, and the industry mostly uses monthly.) But that includes the steeply volatile years of the two Great Depression bear markets, which drag the average up a bit. Since 1926, median standard deviation was 13.0%. (See Exhibit 4.1.) So both 2008 and 2009 were well above the median, and one year was terrible, the other terrific.
It’s also important to remember standard deviation is inherently backward looking. It’s a useful tool but tells you nothing about how volatile or unvolatile anything will be immediately ahead. It describes how stocks behaved in the past on average. Like all historical data, it’s a useful guide—it gives you a range of what’s reasonable to expect. But volatility is never a forecasting tool.
A standard deviation of 0 tells you, historically, returns have never varied—like cash stuffed in your mattress (ignoring inflation’s eroding impact over time). You don’t need historical standard deviation to tell you stocks have been pretty darn volatile. I bring it up because, again, stock market volatility is itself volatile. Some years, market volatility is vastly above average. Some years, it’s vastly below average. And some years, both happen! The front is hugely volatile, and the back isn’t, and vice versa. An average is an average and bakes in huge variability around it.
What’s more, stocks can rise and fall on both above and below-average volatility. There’s no predictive pattern.
The most volatile year ever was 1932—standard deviation was 65.4%.4 But stocks were down just–8.9% for the year. Not great, but not the disaster most would naturally expect from monster volatility. All that tells you is within the year, monthly returns were wildly variable—as you’d expect in the final year of the first down-leg of the Great Depression.
The second most volatile year ever was 1933. Standard deviation was 52.9%—but stocks rose a massive 53.9%.5 That starts to make sense when you get in your bones what volatility is (how much something deviates from its average) and what volatility isn’t (a bad thing that measures only stock market downside).
Big volatility doesn’t mean stocks must fall. In 1998, standard deviation was 20.6%. Way above average, yet stocks were up 28.6%.6 In 2010, standard deviation was 18.4% and stocks rose 15.1%.7 In 1980, standard deviation was 17.4% and stocks boomed 32.3%.8
Yes, big volatility has happened in down years. But not always and not enough to make you automatically fear above-average volatility. And the reverse is true. Lower volatility doesn’t automatically mean big returns. In 1977, standard deviation was a below-average 9.0% and stocks fell –7.4%—returns nearly identical to 1932’s return but with much less volatility.9 Standard deviation was 9.2% in 1953 and stocks fell –1.1%.10 Standard deviation was a low 7.6% in 2005, and stock returns were also low—just 4.9%.11
When standard deviation is around its long-term median (from 12% to 14%) returns also vary hugely. In 1951, standard deviation was 12.1% and US stocks boomed 24.6%.12 In 1973, standard deviation was 13.7%, and US stocks fell –14.8%.13
There is nothing about any level of volatility that is predictive. Rather, standard deviation is descriptive of the past—and the past doesn’t dictate the future.
So volatility isn’t predictive. But it isn’t trending higher, either. Folks may remember the Flash Crash in May 2010, when within mere minutes, broad markets plummeted. Stocks were down nearly 10% at one point intraday, only to quickly reverse most of that mid-day fall (while still ending the day down). The crash was broadly blamed on a string of technical glitches. Many blamed the proliferation of high-frequency trading (HFT), not just for the Flash Crash, but for increasing volatility overall.
But where’s the proof volatility is increasing? Look back at Exhibit 4.1. Sure, volatility was higher in 2008, 2009 and 2010, but it fell off a bit again in 2011. That higher volatility wasn’t out of line with past peaks. And it’s not trending higher—it’s just the same variability of volatility we’ve seen through history.
And if you fear high frequency trading increases volatility, know it existed in 2003, 2004, 2005, 2006 and 2007—when standard deviation was relatively lower. Folks used computers to trade in 1987 when standard deviation hit a peak, but they weren’t doing anything like today’s HFT. Nobody thought of HFT at all in 1974, 1970, 1962 or any other earlier peak volatility period.
See it another way: The Great Depression was wildly volatile—both up and down. Folks tend to think of the Great Depression as one long period of stagnation, but it wasn’t. It was two recessions with a growth interval between and two huge bear markets with a huge bull market between—history’s second biggest.
Volatility then had myriad causes. One was a relative lack of liquidity and transparency. There just weren’t as many stocks then, nor as many transactions and many fewer market participants. Information moved more slowly, so price discovery was tough. Spreads between bid and ask prices for all but the very largest stocks were much greater as a percentage of the total price then, so the bounce between someone hitting the bid or pushing on the ask moved transaction prices a wider percent of the total price. Put all that together and you get much more volatility, regardless of other macro drivers (like disastrous monetary policy, fiscal missteps, insanely ill-gotten trade policy, a lousy economy, massive uncertainty, Hitler’s rise, Huey Long and a whole lot more).
Similarly, thinly traded markets even today are generally more volatile—like penny stocks, micro-cap stocks (frequently the same thing) or very small Emerging Markets countries. Because there are vastly more publicly traded stocks now, vastly more participants and information is easily and instantly available, markets should be inherently less volatile overall than the thinly traded Great Depression days. I’m not saying you’ll wake up next week and stocks will behave like bonds. No! And you don’t want them to if you want them to deliver long-term superior returns. Rather, we’re less prone to get the intensely wild swings we saw then and still see today in thinly traded markets.
Another popular, much-maligned scapegoat for increased volatility (whether or not that increased volatility is actually happening) is speculators.
Speculators aren’t bad. In fact—if you buy a stock, you are, in a sense, a speculator! Even if you hold it for a long period—a year or 10 or 50—when you buy a stock or sell it short, you speculate it’s going to do something. There’s nothing wrong with that.
But that’s not what folks usually mean when they talk about speculators—they’re typically referring to futures traders. A futures contract is an agreement to buy or sell something at an agreed-upon price at a future date—a commodity, a stock index, interest or exchange rate, whatever. Effectively, it’s a bet on future price direction. Often, speculators never take possession of the thing whose price they’re betting on. Maybe they don’t even want to! They’re purely speculating on future price movement and don’t want or need the soybeans, pork bellies, currencies, whatever. This is particularly egregious to those who fear speculators.
When oil prices rise sharply, it’s near guaranteed media headlines will blame speculators—folks messing with the rest of us just to make a quick buck. But they don’t realize: Speculators don’t just bet prices will rise; they often bet prices will fall. And because speculators, as a group, don’t work together, some will speculate prices will rise at the exact time others speculate prices will fall. Speculators aren’t some financial geniuses who only win at our expense. They can and do lose money—just like any investor.
Then, too, when prices fall, you (usually) don’t hear folks blaming speculators for that—though speculators are probably as responsible for downward spikes as they are for upward spikes (i.e., not very).
Plus, there are myriad legitimate reasons to trade futures. Businesses use them all the time to smooth input costs on volatile commodities. Airlines often buy fuel futures to smooth those costs for travelers, and you probably like your airline ticket prices to not swing wildly. Farmers buy futures! They need feed grain, fertilizer, fuel and other commodities, and their profit margins can be hugely impacted by sharp price swings—and commodities are prone to sharp swings. When you think “futures trader” it probably doesn’t conjure an image of American Gothic—but maybe it should.
But futures contracts—and those speculators—play an important role in capital markets. They increase liquidity. They also increase transparency and speed price discovery—also good things. Folks often overlook the benefit of increased liquidity—but again, the mere fact there are more transactions happening can actually reduce volatility.
We can prove this—with onions. In 1958, onion farmers convinced Michigan Congressman (and later President) Gerald Ford speculators were wreaking havoc in onion markets and depressing prices. He sponsored a bill that became law (and remains law to this day) banning speculation in onions.
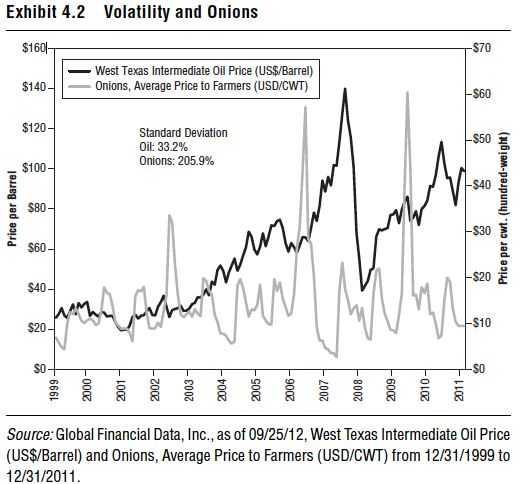
Was it all sunshine and happiness for onions thereafter? Not really. If you think oil is volatile, you’ve never looked at onion prices. Exhibit 4.2 shows onion prices and oil prices—just by eyeballing it, you can tell onions have much huger and more frequent boom/busts. (Hat tip: Mark J. Perry and John Stossel.)
Don’t just trust your eyes. You can measure standard deviation as well. Standard deviation for oil from 2000 through year-end 2011 was 33.2%, but for onions it was 205.9%!
Remember that the next time someone says the cure to the market’s ills is banning speculators. Such a move wouldn’t necessarily reduce volatility, and it may well increase it—along with reducing transparency and slowing price discovery. (Politicians cannot and will not ever understand how free markets work. I’m convinced it’s a virus that destroys part of their brains in the 12 to 24 months after being elected to major office.) So thank a speculator, and don’t fear volatility. It’s not predictive, you can’t get upside volatility without the downside, and over time, upside volatility happens more often. Embrace it.