“If stocks return 10%, I can just forever skim 10% off the top.”
THERE ARE SOME WHO DOUBT stocks can continue delivering superior returns over time. Those folks should have greater faith in capitalism and/or should revisit Chapter 1. But then, there are those who believe in the longterm superiority of stocks. Absolutely! Stocks should average 10% a year from here until eternity. Their faith is so sure, they believe they can skim 10% off the top—easy, peasy—every year. I share their optimism, to a point. I’m not blindly convinced stocks
must average 10% annually in the long period ahead. My guess is they easily beat bonds over long periods and by a wide margin, and long-term returns are likely to be near the 10% historic average but could easily be a bit more or a bit less. But planning to skim 10% a year is a recipe for total disaster: It ignores the huge variability of returns.
Stock Returns Are Superior—And Variable
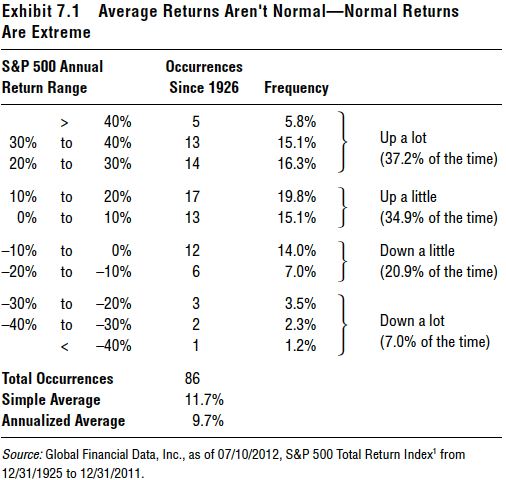
As discussed in Chapter 1 and elsewhere, the variability of stocks’ short-term returns is one reason stocks have superior long-term averages. We all would love stock returns to be steadier (read more in Chapter 17), but that’s not reality. Exhibit 7.1 shows S&P 500 annual return ranges and frequency. The most common result by a plurality (37.2% of all years) is years when stocks finish up huge—over 20%. Next, stocks are most commonly up between 0% and 20%—but rarely are they near 10% on the nose. Some folks have a hard time with this, but disaster years are quite rare—stocks are “down a lot” just 7.0% of all years. Rare! The down years just loom larger in our memories.
You can put yourself in a serious hole if you take 10% at a near-term market low—like when stocks are in a big bear market or even down during a briefer (but very common) correction. This may not matter if you have a very short time horizon. But most readers of this book likely have a much longer one—20 years or more. Maybe much more! Some may say, “Fine, I just won’t have a portfolio that falls that much.” Ok. You can do that, likely by reducing shorter-term volatility by always having a big allocation of fixed income. However, then you reduce your expected return as well. A portfolio like that probably annualizes much less than 10% over long periods. Others may decide to just take gains. In a year when stocks rise 25% (as can happen)—woo hoo!— take the gains, and it’s party time. And stocks do rise more than fall! But what do you do in a year stocks fall 20%, 30% or more as can happen in a bear market? Do you not take cash flows? Do you add more cash to get back to your arbitrary line in the sand? Say you have a $1 million portfolio that falls to $800,000—a normal, short-term move to be expected in an all-equity portfolio. Do you wait until the portfolio reaches $1 million before you take cash flows again? Or does $800,000 become your new baseline? Most folks can’t (or don’t want to) live with so much cash flow variability.
I See 5% CDs
An alternate version of this: Folks may say, “I’ll just forever buy CDs and/or bonds yielding 5%, and that will be a safe way to always have 5% income, forever. No need to touch principal!” Theoretically, if you need $50,000 a year and have a $1 million portfolio, you just keep buying 5% CDs and/or bonds. Sounds good, but that won’t work, either. First, in 2012, 5% CDs are mythical creatures. There are none! Five-year CDs pay under 2%. The best 10-year rate I could find was 2.1%.
2 You know from Chapter 3, 10-year and 30-year Treasurys are yielding 1.6% and 2.8%—
below inflation’s long-term average!
3 Corporate bonds aren’t much better. A firm with a pristine credit rating (which doesn’t guarantee against future default) pays a 2.1% rate.
4 To get higher yields, you must go junk—rates are 6.6% for 10-year bonds as I write.
5 And that’s
junk! If you’re relying on a CD and/or bond strategy for reliable cash flow, a strategy heavily exposed to junk bonds may not be appropriate. Sure, you can buy junk to increase expected return, but if you’re going that route, 6.6% is pretty darn low. Depending on your goals and time horizon, it might make more sense to trade the increased default risk in junk bonds for higher volatility risk in stocks. Longterm returns are likely better with stocks. So, via your CD-strategy, as I write, your $1 million portfolio doesn’t kick off $50,000 but instead likely around $21,000 in a 10-year CD. Yes, interest rates are historically low—for CDs, bonds, etc. Eventually, at some future point, they’ll rise. Maybe you think you’ll just sell what you have now to buy the higher yielding instruments later. But don’t forget: Yield and price have an inverse relationship. As rates rise, the prices of your bonds fall—if you sell, you can sell at a loss. And there are usually penalties if you sell CDs before they mature. Now you’re working from a lower portfolio value. Probably not what you had in mind. Or you could wait it out so you don’t lose principal and just buy higher-yielding instruments as your current ones mature. Fair enough! But while you wait, you likely must accept lower cash flow until then. And who knows how long it will take for 5-year CD rates to go from under 2% to over 5%. Maybe they don’t—not for a long, long time. And even then,
don’t forget inflation. If you need $50,000 in today’s dollars, in 10 years, you’ll likely need over $67,000 just to maintain status quo purchasing power if inflation is anything like the long-term average in the period ahead. In 20 years you’ll need over $90,000! (See Chapter 2.) Hey, maybe interest rates rise really far, really fast—and one day, you
can buy a CD yielding 9%! That would solve your purchasing power problem, wouldn’t it? Probably not. That $90,000 after 20 years assumes inflation is about average over the period ahead. In a world where CDs pay 9% (and not fake ones like the ones convicted Ponzi scammer Sir R. Allen Stanford sold—see Chapter 17), inflation has probably risen a lot, too, and seriously taken a whack out of your purchasing power. Which means that hypothetical future $90,000 may not be enough. So how should you get income from a portfolio? Read on to Chapter 8. Meanwhile, in my view, a wiser long-term strategy is determining the totality of your goals and selecting an appropriate benchmark and long-term asset allocation that increases the likelihood you achieve them. (For guidance on how to do that, read my 2012 book,
Plan Your Prosperity.) And one consideration should be whether that benchmark can sustain your inflation-adjusted cash flows over your long time horizon. The 10% strategy and the 5%-CD-forever plan are both unsustainable myths.
Notes
- The S&P 500 Total Return Index is based upon GFD calculations of total returns before 1971. These are estimates by GFD to calculate the values of the S&P Composite before 1971 and are not official values. GFD used data from the Cowles Commission and from S&P itself to calculate total returns for the S&P Composite using the S&P Composite Price Index and dividend yields through 1970, official monthly numbers from 1971 to 1987 and official daily data from 1988 on.
- Bankrate.com, as of 11/12/2012.
- Bloomberg Finance, L.P., as of 10/25/2012; Global Financial Data, Inc., as of 05/22/2012; Consumer Price Index return from 12/31/1925 to 12/31/2011.
- Bank of America Merrill Lynch US Corporate AAA 7-10 Year Index as of 09/12/2012.
- Bank of America Merrill Lynch US Corporate High-Yield 7-10 Year Index as of 09/1/2012.